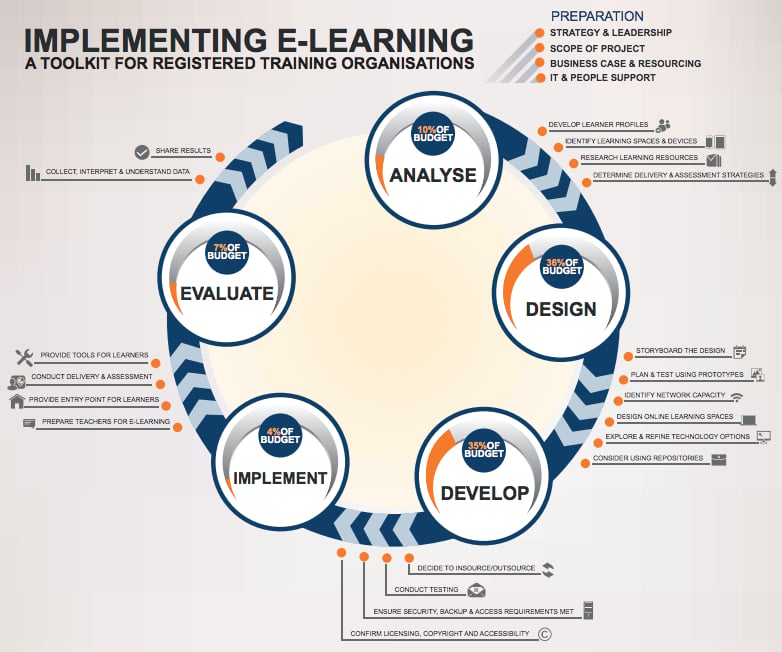
Infographics continue to evolve and improve. A particularly nice example has emerged from the Australian VET (Vocational Education and Training) E-Learning Strategy project. It’s largely self-explanatory (as it should be!), a toolkit for implementing e-learning based on the ADDIE model.
You know the ADDIE model, of course, but just in case … the acronym stands for:
A = Analyse
D = Design
D = Develop
I = Implement
E = Evaluate
Now I haven’t worked out how to embed the fully interactive version in this post, so you’ll have to click on the graphic to take you to the fun stuff. Pretty well everything in the graphic is clickable, so that you can learn about (or remind yourself) of the steps and sub-steps in the process.
And don’t consider it as a ‘book of rules’, but rather as an ‘aide-mémoire’ to be used flexibly and judiciously (or heuristically, if you’d prefer a fancier word). In other words, leave out bits which either don’t apply to your context or are too expensive (in terms of time and/or resources).
So browse through it, and don’t forget to check the ‘extras’, including case studies from each of the Australian states. And if there’s space on your office wall, print a copy to impress your colleagues and friends!